

The Astonishing Spread Of Obesity Across The United States
 X
X Facebook
 Reddit
 Pinterest
 WhatsApp
Check this series of graphs and how it seems as if obesity is contagious. If it was a virus, it’d look like our days are numbered!
1994
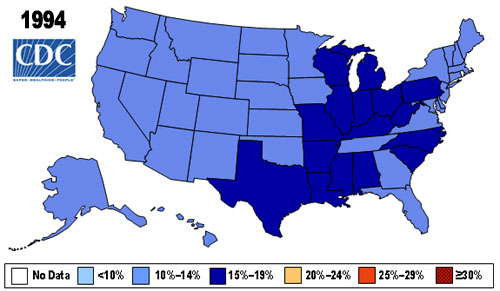
In 1994, the first year the Center for Disease Control (CDC) had data for all states, there is not one state where the rate of obesity (a BMI higher than 30) goes beyond 20%.
What stands out is that the “heavier” states are clustered, with a good portion located in the South. It’s a foreshadowing of what’s to come:
1997
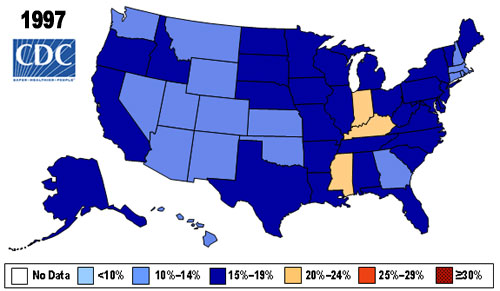
In 1997 the first states, Mississippi, Kentucky and Illinois, break the 20% barrier.
1999
By 1999, almost the entire South and them some have joined them, although Indiana went back to a lower rate. Note again how the states cluster whose obesity rates increased the most.

2001
In 2001, Mississippi is the first state to go beyond the 25% marker and Indiana is back to where it was. Colorado is the last state below 14%.

2005
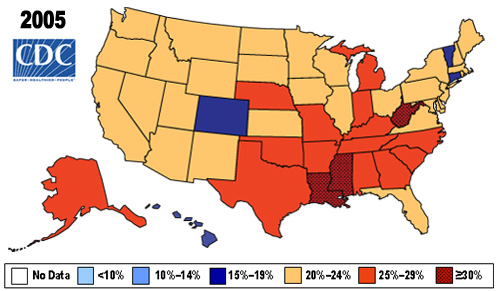
The rate accelerates. Four years later three states go beyond 30%, Louisiana, Mississippi and West Virginia. Almost the entire South now reaches 25% or more. Colorado worsens as well and goes to at least 15% obese.
2010
2010, the last year the CDC published data for, has no state below 20%. Large portions of the South are beyond 30% and they have company from several states in the North.

And Then?
What will we see in 2015? Will it all be a sea of deep red?
Statue of Liberty photo courtesy of Derek Jensen, graphics courtesy of the CDC.
Tags: diet, health, obesity, united states, weight loss
2 Comments
I’m in Canada, which is “supposedly” better than the US in terms of obesity, yet one trip to the local swimming pool yields a clear image of the proportion of people who are overweight. From my personal observation, it’s 25% of children, 33% of teenagers, and 50% of adults. And those are people who go to the pool!
I certainly didn’t need this to know what I observe every day! The important thing to me, however, is that when I look down, I don’t see this at all 🙂